
Hier zeige ich euch, wie ihr in ein paar Minuten ein cooles Dashboard bekommt, welches euch diverse Sachen über euren Server anzeigt. Traefik dient uns hier als Reverse Proxy und stellt später den Dienst verschlüsselt per TLS bereit.
| Datum | Änderungen |
|---|---|
| 14.04.2020 | Erstellung dieser Anleitung. |
| 27.04.2020 | Traefik “secHeaders” hinzugefügt. Dashboard erweitert. |
| 03.01.2022 | Bilder erneuert. |
| 30.03.2022 | cadvisor Image angepasst. Danke an @Jonas @Jürgen |
| 15.12.2022 | Docker Compose v2, Traefik Labels angepasst, Kapitel 0 hinzugefügt |
| 29.05.2023 | Anpassung an neue Traefik Anleitung |
| 05.01.2024 | Link zu Traefik v3 angepasst, neues Dashboard hinterlegt |
| 17.02.2025 | Docker Volume angepasst. Danke an @moritzm |
So kann später dann euer Dashboard aussehen:
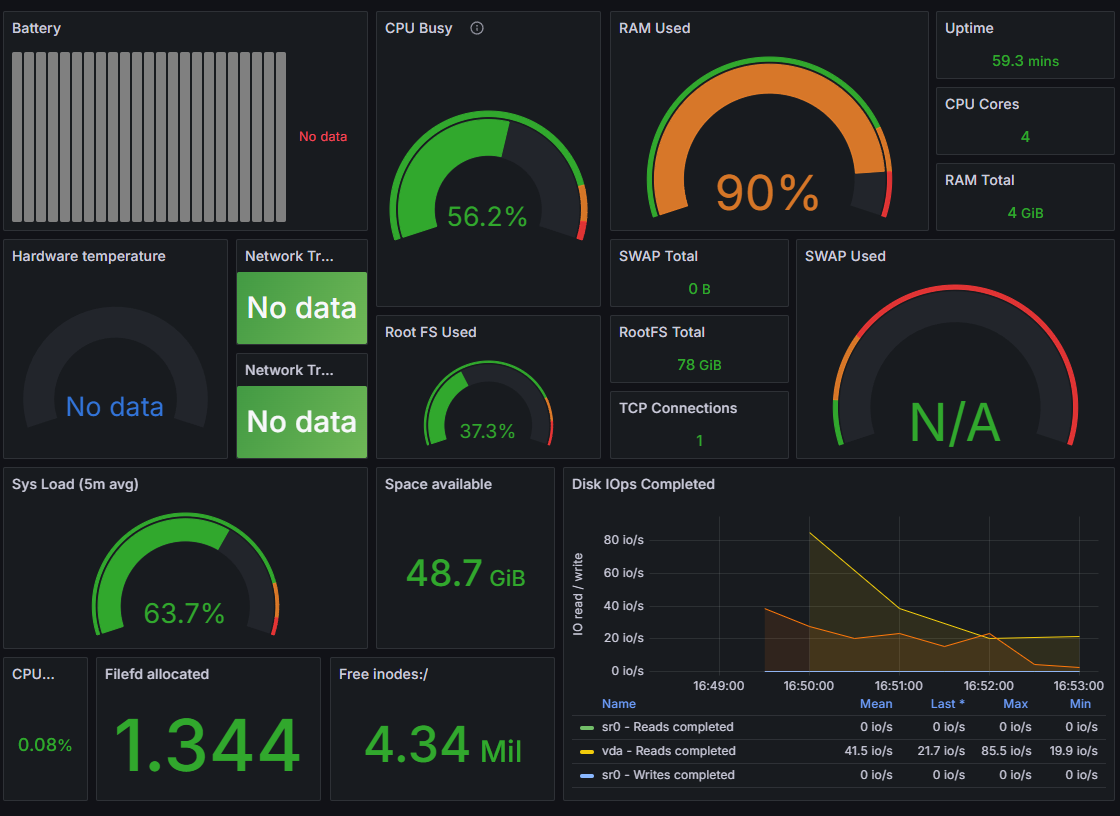
Dazu werden wir gleich folgende Tools installieren
- Prometheus
- node-exporter
- cadvisor
- grafana
0. Grundvoraussetzung
- Docker & Docker Compose v2 (Debian / Ubuntu)
- Traefik V3 Installation, Konfiguration und CrowdSec-Security
1. Ordner anlegen
Zuerst legen wir uns passende Ordner-Strukturen an.
mkdir -p /opt/containers/grafana/{grafana,prometheus}Nun ändern wir noch die Berechtigungen.
chown 1000:1000 /opt/containers/grafana/grafana2. Docker Compose anlegen
Hier legen wir die Docker Compose an.
nano /opt/containers/grafana/docker-compose.ymlInhalt:
services:
  mon_prometheus:
    image: prom/prometheus:latest
    container_name: mon_prometheus
    restart: unless-stopped
    volumes:
      - ./prometheus/prometheus.yml:/etc/prometheus/prometheus.yml
    depends_on:
      - mon_node-exporter
      - mon_cadvisor
    networks:
      - default

  mon_node-exporter:
    image: prom/node-exporter:latest
    container_name: mon_node-exporter
    restart: unless-stopped
    volumes:
      - /proc:/host/proc:ro
      - /sys:/host/sys:ro
      - /:/rootfs:ro
    command:
      - '--path.procfs=/host/proc'
      - '--path.sysfs=/host/sys'
      - '--path.rootfs=/rootfs'
      - '--collector.filesystem.ignored-mount-points="^(/rootfs|/host|)/(sys|proc|dev|host|etc)($$|/)"'
      - '--collector.filesystem.ignored-fs-types="^(sys|proc|auto|cgroup|devpts|ns|au|fuse\.lxc|mqueue)(fs|)$$"'
    networks:
      - default

  mon_cadvisor:
    image: gcr.io/cadvisor/cadvisor
    container_name: mon_cadvisor
    restart: unless-stopped
    volumes:
      - /:/rootfs:ro
      - /var/run:/var/run:rw
      - /sys:/sys:ro
      - /var/lib/docker/:/var/lib/docker:ro
    networks:
      - default

  mon_grafana:
    image: grafana/grafana:latest
    container_name: mon_grafana
    restart: unless-stopped
    volumes:
      - /opt/containers/grafana/grafana:/var/lib/grafana
    user: "1000"
    depends_on:
      - mon_prometheus
    labels:
      - "traefik.enable=true"
      - "traefik.http.routers.grafana.entrypoints=websecure"
      - "traefik.http.routers.grafana.rule=(Host(`grafana.euredomain.de`))"
      - "traefik.http.routers.grafana.tls=true"
      - "traefik.http.routers.grafana.tls.certresolver=http_resolver"
      - "traefik.http.routers.grafana.service=grafana"
      - "traefik.http.services.grafana.loadbalancer.server.port=3000"
      - "traefik.docker.network=proxy"
      - "traefik.http.routers.grafana.middlewares=default@file"
    networks:
      - proxy
      - default

networks:
  proxy:
    external: trueCode-Sprache: JavaScript (javascript)
Notwendige Anpassungen:
- eure URL eingeben bei Traefik (grafana.euredomain.de)
3. prometheus.yml anlegen
Nun legen wir noch eine Konfigurationsdatei für Prometheus an.
nano /opt/containers/grafana/prometheus/prometheus.ymlglobal:
scrape_interval: 15s
evaluation_interval: 15s
rule_files:
scrape_configs:
- job_name: 'node-exporter'
static_configs:
- targets: ['mon_node-exporter:9100']
- job_name: 'cadvisor'
static_configs:
- targets: ['mon_cadvisor:8080']Code-Sprache: PHP (php)4. Grafana starten
Wie gewohnt starten wir nun Grafana mittels folgendem Befehl:
docker compose -f /opt/containers/grafana/docker-compose.yml up -d5. Grafana Konfigurieren
5.1 Einloggen
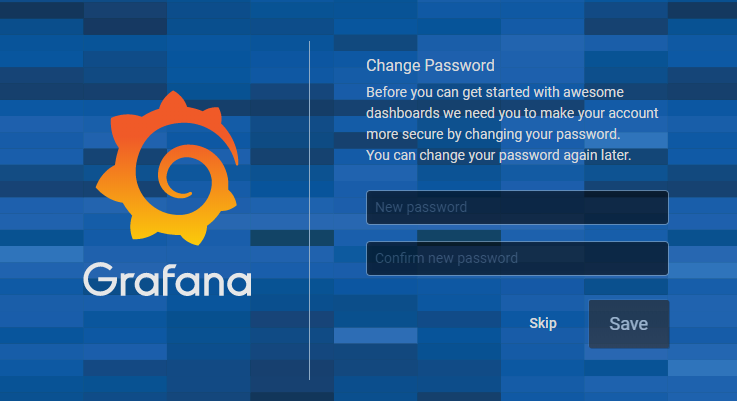
Nun geht ihr auf “grafana.euredomain.de” und solltet folgendes sehen:

Die Zugangsdaten lauten:
- Name: admin
- Passwort: admin
Wenn ihr euch einloggt, werdet ihr aufgefordert das Kennwort zu ändern.
Nun solltet ihr folgendes sehen.
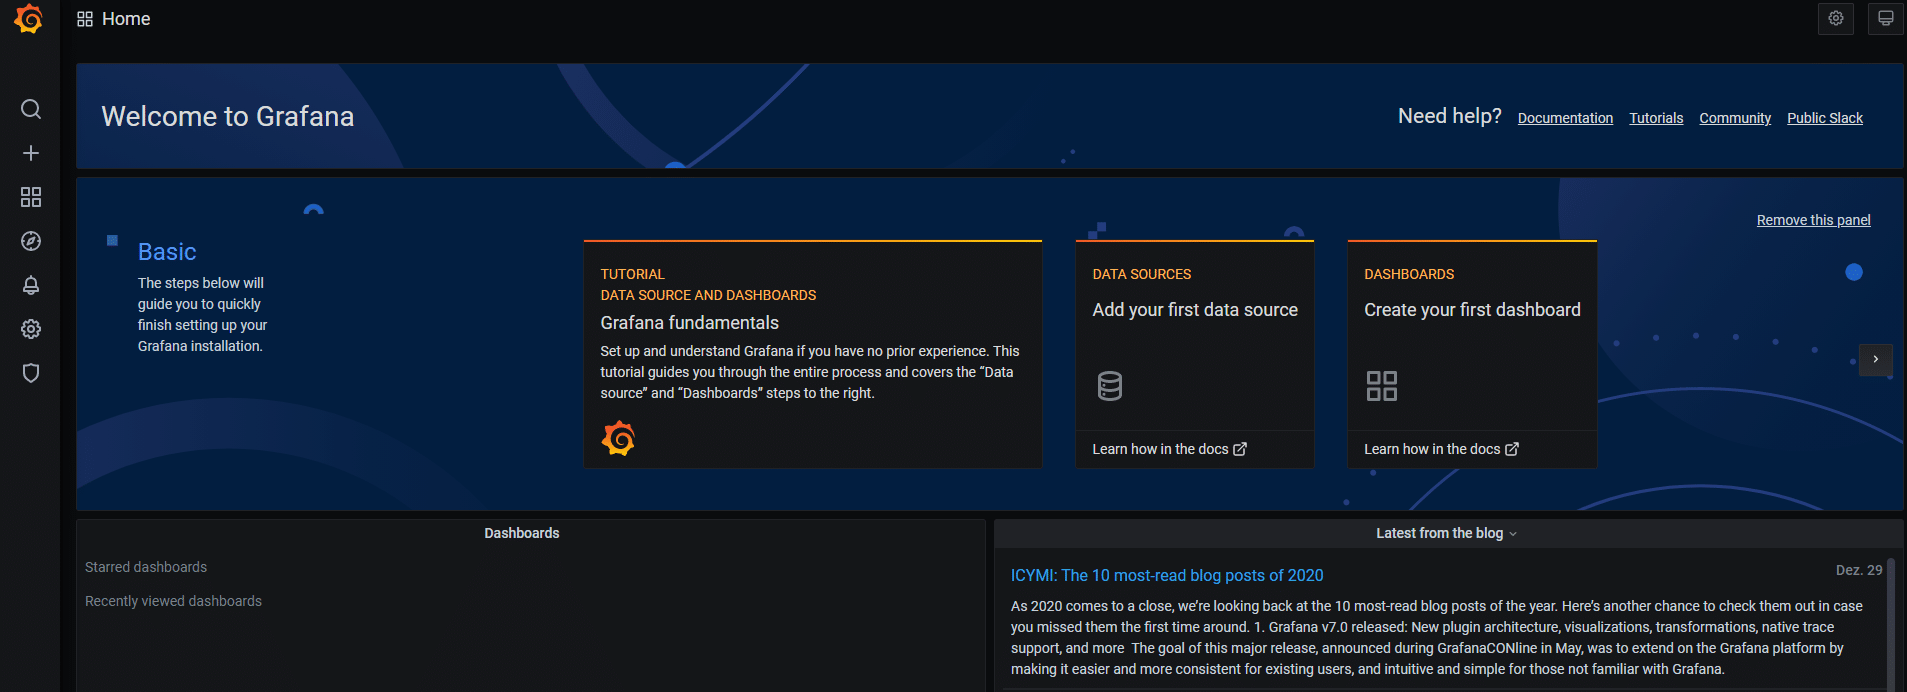
5.2 Mit Prometheus Datenbank verbinden
Nun klickt ihr auf “Add data source”.
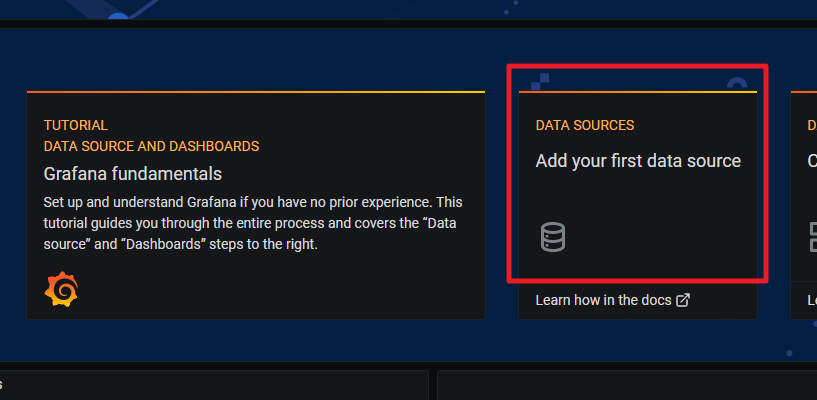
Hier wählt ihr “Prometheus” aus.

Hier gebt ihr nun unter “URL” folgendes ein:
http://mon_prometheus:9090Code-Sprache: JavaScript (javascript)
Nun scrollt ihr nach unten und klickt auf “Save & Test”. Wenn alles ok ist, dann sollte es bei euch so aussehen.

5.3 Dashboard hinzufügen
Ihr könnt euch nun ein Dashboard selbst zusammenbauen oder eins kostenlos von der Grafana Community beziehen.
Wenn ihr mein Dashboard haben wollt, so müsst ihr folgendes tun.
Klickt auf das “+” links oben und wählt “Import” aus.

Nun gebt ihr folgendes ein: “14731” und klickt auf “Load”.

Jetzt seht ihr folgendes:
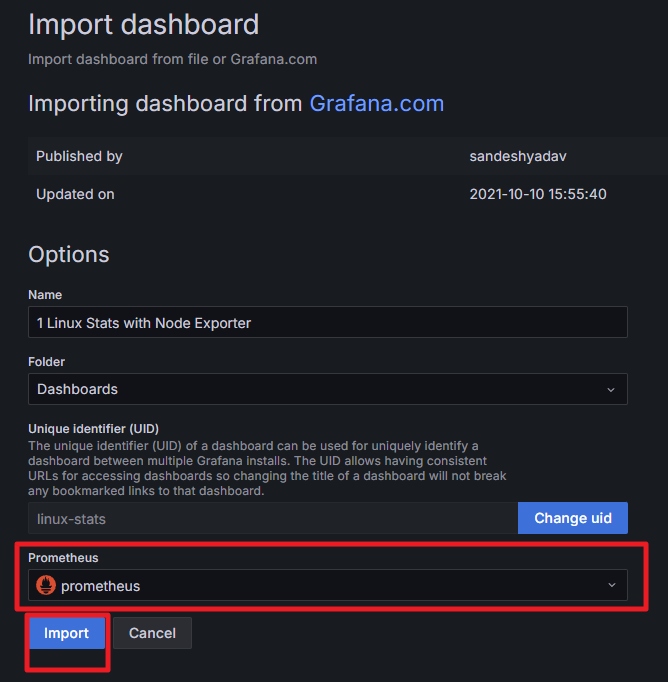
Wählt hier nun ganz unten “prometheus” aus und klickt “Import”.
Jetzt solltet ihr folgendes sehen.


gibts da einen kleinen fehler?
hat bei mir so nicht funktioniert, volume kann ja keine datei sein oder?
Hallo an alle,
ich habe mir die Traefik Metriks mit in Grafana eingebunden:
Dazu habe ich folgendes gemacht:
/opt/containers/traefik-crowdsec-stack/traefik/traefik.yml
metrics:
prometheus:
addRoutersLabels: true
addEntryPointsLabels: true
addServicesLabels: true
buckets: 0.100000, 0.300000, 1.200000, 5.000000
entryPoint: metrics
entryPoints:
metrics:
address: :8899
(Das wird auch im Traefik-Dashboard angezeigt)
/opt/containers/grafana/prometheus/prometheus.yml
scrape_configs:
– job_name: ‘traefik’
static_configs:
– targets: [‘traefik:8899’]
/opt/contaimers/grafana/docker-compose.yml
services:
mon_prometheus:
networks:
– default
– proxy
(damit der prometheus den traefik auch sehen kann)
Jetzt in Grafana das Board 17346 importieren.
Gibt noch einen kleinen Trick, sich ein Dashbord zu importieren:
Hier ein Dashboard raussuchen:
https://grafana.com/grafana/dashboards/
Dann sich die Nummer merken
Also bei diesem: https://grafana.com/grafana/dashboards/1860-node-exporter-full/ wäre es 1860.
Dann
Dashboards / New / Import / – in der Mitte die Nummer eingeben – Prometheus – Datasource auswählen / Import
hey hab folgendes Problem.
Erst läuft es und nach einer weile bekomme ich dieses Bild
If you’re seeing this Grafana has failed to load its application files
1. This could be caused by your reverse proxy settings.
2. If you host grafana under subpath make sure your grafana.ini root_url setting includes subpath. If not using a reverse proxy make sure to set serve_from_sub_path to true.
3. If you have a local dev build make sure you build frontend using: yarn start, or yarn build
4. Sometimes restarting grafana-server can help
5. Check if you are using a non-supported browser. For more information, refer to the list of supported browsers.
Unbedingt compose im grafana Ordner abschießen. Prometheus findet ansonsten seine config nicht.
Guten Abend
zuerst einmal muss ich mich bedanken für die super Anleitung! Hat fast auf anhieb funktioniert. Warum fast? Ja ich glaub, das liegt an cadvisor.
Da funktionieren wohl nicht alle Versionen.
Hab nach langer Suche folgendes herausbekommen:
die Zeilen in der Compose lauten:
mon_cadvisor:
container_name: cadvisor
image: gcr.io/cadvisor/cadvisor:latest
…
das funktioniert leider nicht. Der Dienst startet nicht
mit den Versionen 0.47.2 sowie 0.45.0 geht es.
mon_cadvisor:
container_name: cadvisor
image: gcr.io/cadvisor/cadvisor:v0.47.2 #v0.45.0 v0.47.2
…
Das hat 3 Stunden gedauert, bis ich das gefunden hab. Das muss ja nicht jeder machen
Guten Morgen, ich hatte ebenfalls das Problem, dass er Prometheus mit dem Hostname http://mon_prometheus:9090 nicht verbinden konnte, ich musste tatsächlich via docker ps die Container ID raussuchen, dann mit docker inspect die IP des Containers selbst herrausfinden und diese dann als URL eintragen. Dann lief es bei mir, vielleicht hilft es ja jemanden. ^-^
Hallo Zusammen
Danke für die wirklich gute Anleitung.
Allerdings stosse ich auf ein Problem mit dem Zertifikat für die Subdomain – es wird nicht generiert.
Laut der Anleitung wird in den Labels der entrypoint “websecure”, _.grafana.tls=true und _.grafana.certresolver=http_resolver verwendet – wie für den traefik proxy zur Generierung von Zertifikaten vorgesehen.
Ich habe mittels –force-recreate alle Dienste neugestartet und im traefik dashboard wird der Router und der Service für grafana auch fehlerfrei angelegt.
Kann mir jemand helfen und aufzeigen wie man das Problem am besten untersucht?
Viele Grüsse
Alex
Hi Christian,
bei mir kommt Prometheus einfach nicht hoch – habe nichts an der Config geändert.. keine Ahnung was da los ist. Any ideas?
Guten Abend (:
sag mal wie kann ich unter deiner anleitung auch weitere dashboards hinzufügen? zb wie ich den Datenverbrauch meines routers bekommen?
also wie kann ich einsehen, wie GB oder auch T ich pro tag/ pro monat verbrauche (:
am besten sogar evtl einsehen von allen geräten in meinem netzwerk?
das wäre super cool von dir (:
deine anleitung ist echt geil (:
danke dir dafür auf jedenfall
Hallo,
erstmal danke für die Anleitung.
Ich hatte am Anfang mit dem “”User: 1000″”
nach dem ich den auskommentiert hatte und allen Verzeichnissen wieder root:root verpasste hatte lief das.
hier mal der Link dazu: https://grafana.com/docs/grafana/latest/setup-grafana/installation/docker/#migrate-to-v51-or-later
Nun habe ich noch das Problem das mein Grafana Container einfach keine IP bekommt.
Ich habe den default durch backend ersetzt und auch auf default gelassen. (backend hatte ich natürlich vorher angelegt).
Egal wie ich es anstelle ich bekomme einfach für den Grafana Container keine IP Adresse.
Getestet habe ich folgendes:
service:
mon_grafana:
.
.
networks:
proxy:
ipv4_address: 172.18.0.5
backend:
ipv4_address: 172.19.0.5
oder eben mit automatischer vergabe
service:
mon_grafana:
.
.
networks:
– proxy
– backend
Die Netzwerke funktionieren, da die anderen Container ja im Backend IP Adressen bekommen und das Proxy Netz schon andere Container (Traefik,Portainer,Watchtower, ….. ) enthalten die alle neben einer IPv4 auch IPv6 bekommen ohne Probs ( ps IPv6 bekommt der Grafana Container auch keine )
Hier noch mal meine komplette Docker-Compose-File
version: ‘2.5’
services:
mon_prometheus:
image: prom/prometheus:latest
container_name: mon_prometheus
restart: unless-stopped
volumes:
– ../prometheus/prometheus.yml:/etc/prometheus/prometheus.yml
depends_on:
– mon_node-exporter
– mon_cadvisor
networks:
– default
#backend:
#ipv4_address: 172.19.0.2
mon_node-exporter:
image: prom/node-exporter:latest
container_name: mon_node-exporter
restart: unless-stopped
volumes:
– /proc:/host/proc:ro
– /sys:/host/sys:ro
– /:/rootfs:ro
command:
– ‘–path.procfs=/host/proc’
– ‘–path.sysfs=/host/sys’
– ‘–path.rootfs=/rootfs’
– ‘–collector.filesystem.ignored-mount-points=”^(/rootfs|/host|)/(sys|proc|dev|host|etc)($$|/)”‘
– ‘–collector.filesystem.ignored-fs-types=”^(sys|proc|auto|cgroup|devpts|ns|au|fuse\.lxc|mqueue)(fs|)$$”‘
networks:
– default
#backend:
#ipv4_address: 172.19.0.3
mon_cadvisor:
image: gcr.io/cadvisor/cadvisor
container_name: mon_cadvisor
restart: unless-stopped
volumes:
– /:/rootfs:ro
– /var/run:/var/run:rw
– /sys:/sys:ro
– /var/lib/docker/:/var/lib/docker:ro
networks:
– default
#backend:
#ipv4_address: 172.19.0.4
mon_grafana:
image: grafana/grafana:latest
container_name: mon_grafana
restart: unless-stopped
volumes:
– /opt/containers/grafana/grafana:/var/lib/grafana
#user: “1000”
depends_on:
– mon_prometheus
labels:
– “traefik.enable=true”
– “traefik.http.routers.grafana.entrypoints=https”
– “traefik.http.routers.grafana.rule=(Host(
grafana.meinedomain.dev))”– “traefik.http.routers.grafana.tls=true”
– “traefik.http.routers.grafana.tls.certresolver=http”
– “traefik.http.routers.grafana.service=grafana”
– “traefik.http.services.grafana.loadbalancer.server.port=3000”
– “traefik.docker.network=proxy”
– “traefik.http.routers.grafana.middlewares=default@file”
networks:
– proxy
#ipv4_address: 172.18.0.5
#ipv6_address: 2a03:4000:56:f4a:2::5
– default
#backend:
#ipv4_address: 172.19.0.5
networks:
proxy:
external: true
# backend:
# external: true
Die auskommentierten Zeilen habe ich mal drinne gelassen um dir zu zeigen was ich schon alles probiert habe.
Vielleicht hast du ja ne Lösung
System ist ein Debian 11 auf KVM Server (mit VMX Flag)
Zudem habe ich noch einen NDP Proxy laufen damit das IPv6 durchgereicht wird (die IPv6 Konfig meines Anbieters ist da nicht ganz sauber deswegen ist das notwendig)
Weis nicht ob es wichtig ist aber es läuft noch eine UFW mit Anpassungen für Docker drauf hier mal die Regeln die für Docker relevant sind:
[ 2] 172.20.0.2 27999/udp ALLOW FWD Anywhere # allow wireguard 27999/udp wireguard_default
[ 3] 172.18.0.2 80/tcp ALLOW FWD Anywhere # allow traefik 80/tcp proxy
[ 4] 172.18.0.2 443/tcp ALLOW FWD Anywhere # allow traefik 443/tcp proxy
Auch wenn Portainer hier nicht aufgeführt ist. Dank Traefik Freigabe funktioniert das alles
Ich bekomme folgenden Fehler, wenn ich ‘docker-compose up’ ausführe:
Attaching to mon_cadvisor, mon_grafana, mon_node-exporter, mon_prometheus
mon_grafana | GF_PATHS_DATA=’/var/lib/grafana’ is not writable.
mon_grafana | You may have issues with file permissions, more information here: http://docs.grafana.org/installation/docker/#migrate-to-v51-or-later
mon_grafana | mkdir: can’t create directory ‘/var/lib/grafana/plugins’: Permission denied
mon_grafana exited with code 1
Wie in den Docs empfohlen, versuchte ich es auch mit dem ‘user 104’, doch ebenfalls ohne Erfolg.
Hat jemand einen Tipp?
Ich glaube beim grafana service ist das “networks: – default” zu viel. Kommt ja unten noch mal und dann korrekt inkl. Proxy-Netzwerk. Zumindest hat Portainer vorher gemeckert.
Ich habe noch /etc/grafana als Volume bei grafana eingebunden, da ich dann die grafana.ini bearbeiten kann. War nötig, da ich OAuth2 von Google nutze und damit dann der Login möglich ist.
Ein Problem hab ich mit dem Dashboard. Bei mir funktioniert die “Memory Usage per Container” nicht. Irgendeine Idee?
Pefekte Anleitung, danke!
Es ist so unfassbar brauchbar. Immer wenn ich ein Tutorial suche lande ich hier 😀 und freue mich weil ich weiß dann funktioniert es 😀
Hi, leider sind bei mir ebenfalls viele Felder leer (N/A). Ich betreibe alle Container mit Portainer und bin immer als root unterwegs, vielleicht kommt sich das ja mit der UserID 1000 in die Quere…hat jemand eine Idee?
Hi, wollte eben bescheid geben, dass “google/cadvisor” als DEPRECATED markiert ist und neue images nur noch unter “gcr.io/cadvisor/cadvisor” kommen.
Deine Anleitung hat super funktioniert. Bis auf dass der cadvisor immer abgeschmiert ist und dann keine Metriken der Container kamen.
In einem Forum bin ich dann auf den Punkt gestoßen
image: gcr.io/cadvisor/cadvisor
nachdem ich das obige Image verwendet habe gings.
Vielleicht ist das ja ein Problem das andere auch haben
Hi Christian,
vielen Lieben dank für die ganzen guten Beschreibungen. Hut ab.
Ich habe bei mit Docker Rootless laufen kann es sein das Grafana/Prometheus root rechte benötigt.
Beste Grüße
Rainer
Hallo.
Ich bekomme leider nachdem ich unter URL folgendes eingetragen habe “http://mon_prometheus:9090” folgende Fehlermeldung: HTTP Error Bad Gateway. Ich hoffe mir kann da vielleicht jemand weiterhelfen.
Grüße Ted
Hallo Christian,
vielen Dank für die sehr gute Anleitung!
Gibt es eine Möglichkeit auf Grafana ein User zu anlegen, der ohne Anmeldedaten auf die Übersicht (Dashboard) kommt? Das wäre für mich interessant, vielleicht hast du eine Idee wie das funktioniert. Wäre cool, wenn du das mit uns teilst.
Vielen Grüße
Koray
Hallo,
Danke Christian für die Anleitung und danke Jonas für den Hinweis!
Leider bekomme ich bei diversen Tabellen die Meldung: ‘N/A’, ‘No Data’ oder ‘No data to show’.
Bin der oben stehenden Anleitung Step by Step gefolgt, da frag ich mich nun was habe ich falsch gemacht oder was ich noch ändern muss? Hat da jemand von euch ein Hinweis? Wäre cool, danke.
Grüsse
Gabriel
Hi Christian!
Nachdem ich deiner Anleitung gefolgt war, bekam ich auf meinem Dashboard immer wieder eine Fehlermeldung und viele Kacheln waren leer.
Ich habe nach einiger Zeit herausgefunden, dass in der JSON-File in Zeile 6 bei “datasource” “Prometheus” statt ” – Grafana – ” stehen muss, weil die Datasource die vorher erstellt wurde so heißt.
Vielleicht ein Hinweis, falls jemand das gleiche Problem hat 🙂
Liebe Grüße
Jonas
Hast du dir das Thema “Alerts” mal angeschaut? Macht eigentlich Sinn! Du kannst direkt in deiner Docker-Compose Datei den smtp Host definieren und in grafana “Alerts” einrichten. Würde mich interessieren ob es bei dir klappt.
Hallo wie kann ich mir den die Server “Uptime” ins Dashboard einbauen?
Hast du zufällig damit schon Kontakt gehabt?
Grüße